Test Suite Performance Engineering: From Repeated Setup to Predictable Fast Feedback
Most teams treat test speed as a byproduct. We treated it as an engineering system with measurable bottlenecks and explicit design constraints:
- keep integration-level confidence
- preserve suite isolation
- avoid introducing test-order coupling
- reduce pull request feedback time
This post covers the technical strategy behind the improvement work. Internal topology, private identifiers, and raw baseline timings are intentionally omitted.
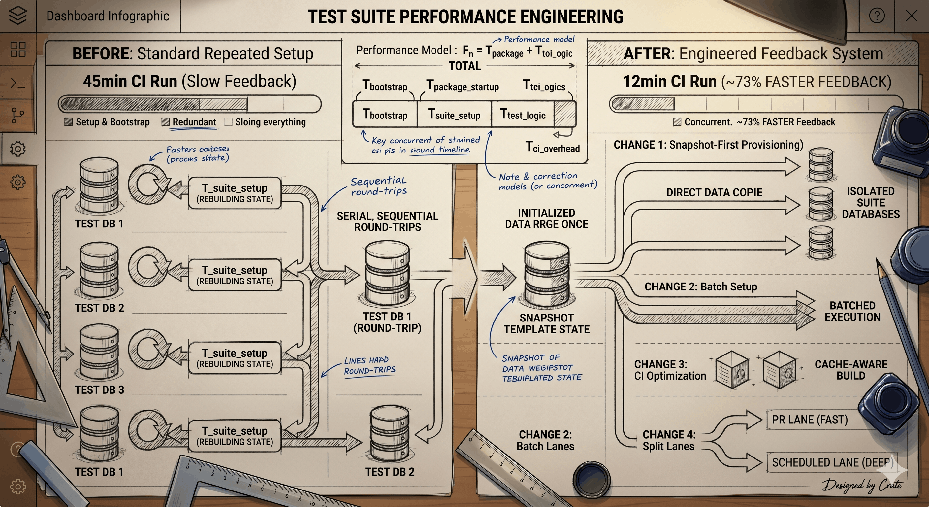
Performance Model
We started by modeling total PR test time as:
T_total ~= T_bootstrap + T_package_startup + T_suite_setup + T_test_logic + T_ci_overhead
In our case, T_suite_setup and T_ci_overhead were dominant:
- setup repeated similar initialization across suites
- setup involved multiple sequential round-trips before assertions began
- CI bootstrap re-did expensive work that could be cached or built once
The key insight: reducing repeated setup costs gives multiplicative gains because those costs are paid many times per run.
Change 1: Snapshot-First Suite Provisioning
Previous pattern
Each suite effectively rebuilt database state through repeated setup operations before running test assertions.
New pattern
We switched to a snapshot-first approach:
- create or reuse a fully initialized template state once per test process
- provision an isolated suite database
- replay cached setup statements in bulk
- copy seed state efficiently
Why it works
- amortizes expensive setup work across suites
- keeps isolation by retaining per-suite databases
- improves stability under parallel package execution by minimizing setup variance
Reliability guardrails
- bounded retries for transient setup failures (with backoff)
- hard failure for true setup defects (rather than masking regressions)
- explicit handling for infrastructure-unavailable scenarios in local/dev contexts
Change 2: Batch Setup to Minimize Round-Trips
Network/database round-trips in setup are often hidden latency. We reduced startup overhead by consolidating setup operations into fewer execution steps.
Technical benefits:
- lower per-suite handshake overhead
- less contention during high parallelism
- tighter latency distribution for setup-heavy integration packages
This did not change business assertions; it changed how fast suites become ready to assert.
Change 3: CI Path Optimization for PR Workflows
Test runtime improvements can be erased by CI inefficiencies, so we tuned both layers.
Parallelism shaping
Instead of unconstrained parallel execution, we cap effective parallelism for shared CI services. This avoids saturation regimes where adding workers increases queueing and contention.
Cache-aware tooling
We rely on cache reuse for:
- module dependencies
- build artifacts
- test helper binaries
The first pipeline pays cold-start cost; subsequent pipelines operate closer to warm-cache behavior.
Build-once bootstrap
We moved to a single build artifact in bootstrap flows, then reused it for migration/seed and test commands, removing repeated compile overhead in the same job.
Change 4: Split Quality Lanes (Fast PR vs Deep Scheduled)
Race detection remains critical, but running it on every PR can dominate cycle time. We separated quality lanes:
- PR lane: fast, high-signal validation for merge confidence
- scheduled lane: heavier instrumentation checks on recurring cadence
This keeps rapid feedback in the developer loop without removing deep verification coverage.
Observed Outcomes (High Level)
Across the combined changes, we observed:
- CI wall-clock time reduced from approximately 45 minutes to approximately 12 minutes (~73% reduction)
- high double-digit percentage reduction in PR feedback time
- meaningful reduction in setup-phase share of total runtime
- improved run-to-run consistency for similarly sized changes
For developer experience, this translated to less idle waiting and faster correction loops.
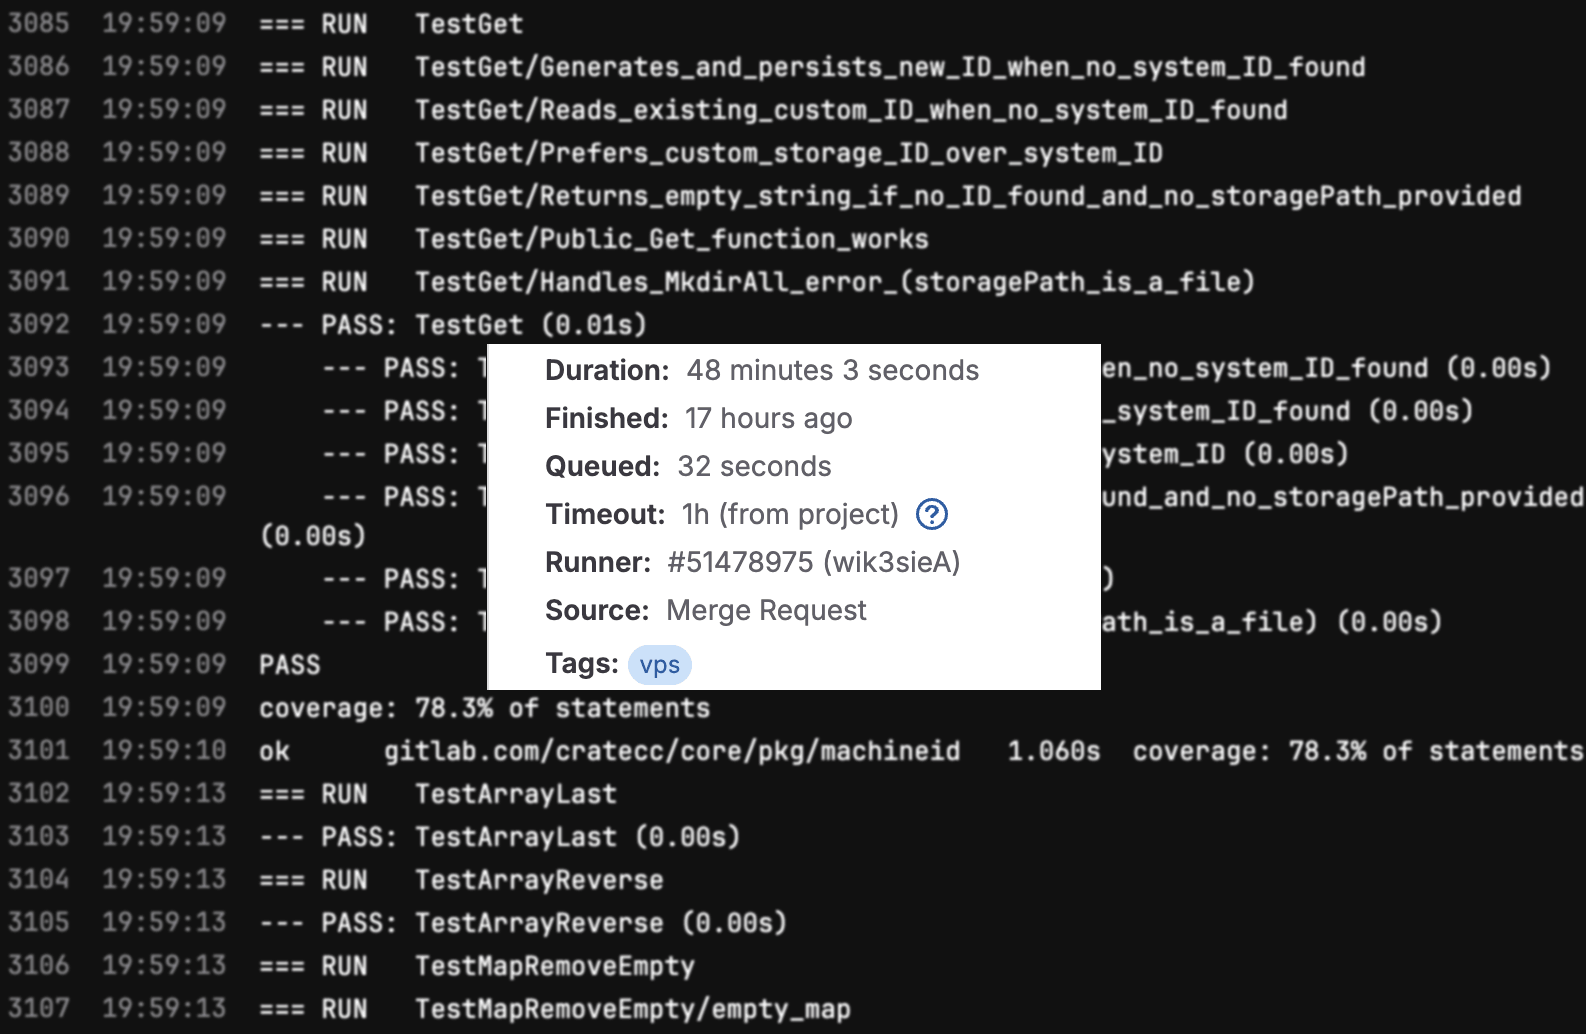
CI Runtime Evidence
Before optimization (~50 minutes):
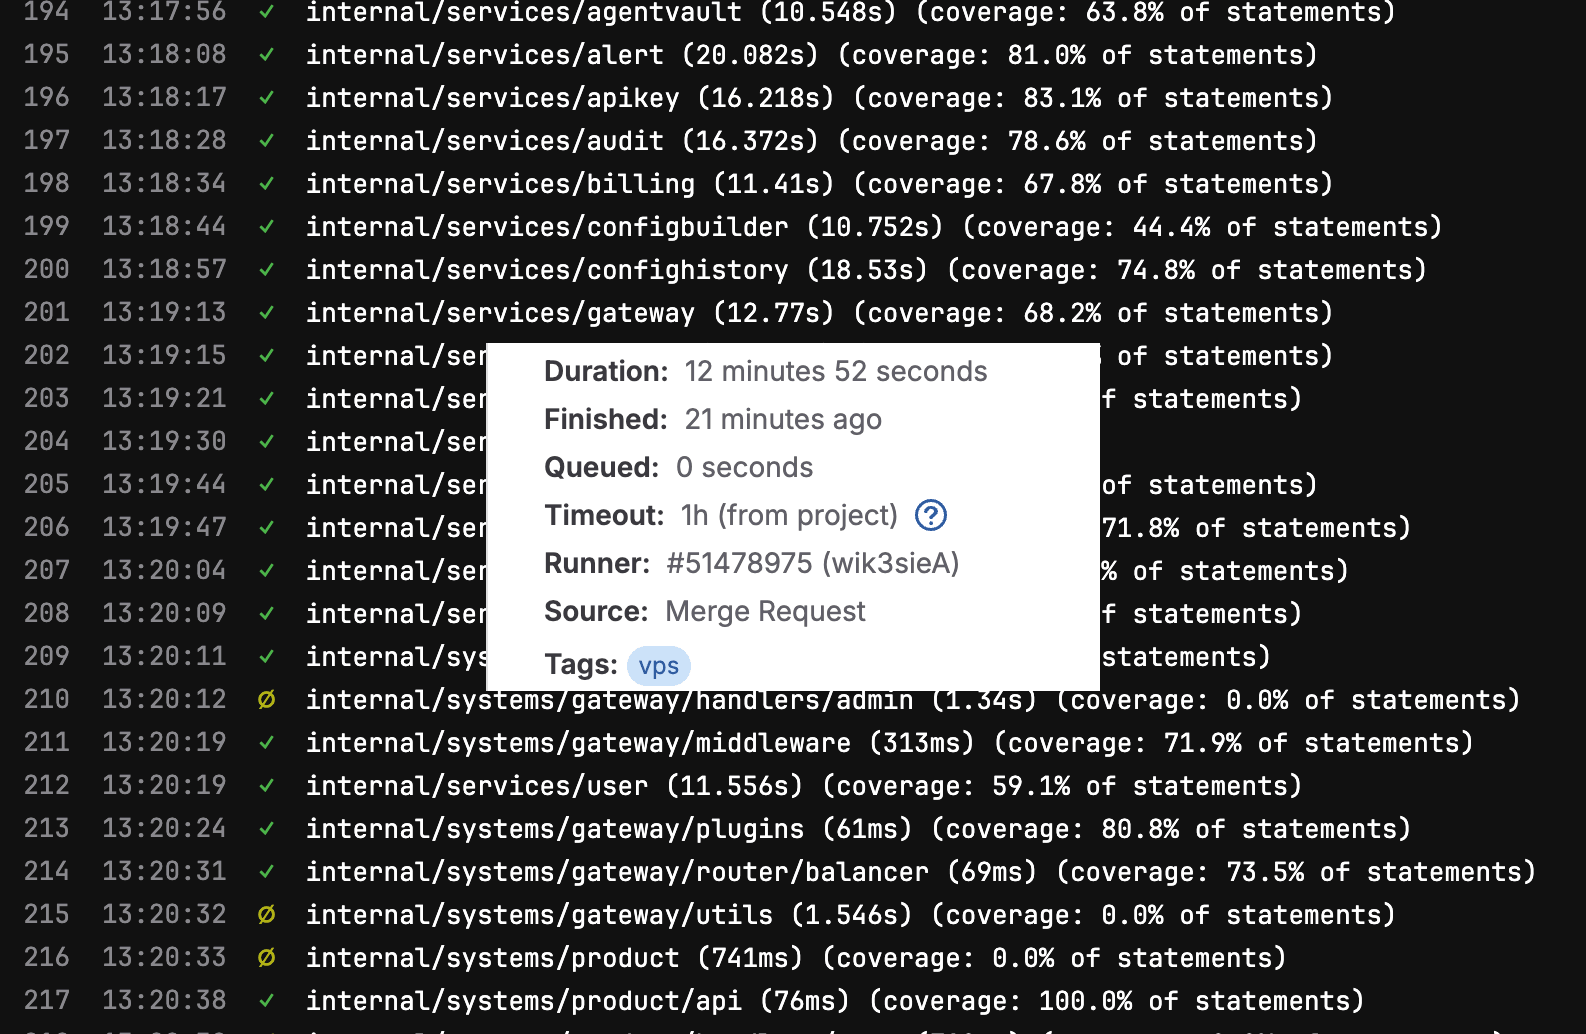
After optimization (~12 minutes):
Visual Feedback: Log Signal-to-Noise Improvement
Beyond runtime, we improved CI log ergonomics.
Previous default output was verbose and nested, which made package-level scanning slower:
--- PASS: TestAPITestSuite (0.01s)
--- PASS: TestAPITestSuite/TestMarshal (0.00s)
--- PASS: TestAPITestSuite/TestMarshal/response_with_details_and_no_error (0.00s)
--- PASS: TestAPITestSuite/TestMarshal/response_with_error_and_no_details (0.00s)
--- PASS: TestAPITestSuite/TestMarshal/response_with_both_details_and_error (0.00s)
--- PASS: TestAPITestSuite/TestMarshal/empty_response (0.00s)
--- PASS: TestAPITestSuite/TestWriteContextPropagation (0.00s)
--- PASS: TestAPITestSuite/TestWriteHeadersAndStatus (0.00s)
--- PASS: TestAPITestSuite/TestWriteSuccess (0.00s)
--- PASS: TestAPITestSuite/TestWriteSuccess/successful_response_with_data (0.00s)
--- PASS: TestAPITestSuite/TestWriteSuccess/error_response (0.00s)
--- PASS: TestAPITestSuite/TestWriteSuccess/empty_response (0.00s)
--- PASS: TestAPITestSuite/TestWriteWithMarshalError (0.00s)
--- PASS: TestAPITestSuite/TestWriteWithWriteError (0.00s)

PASS
Current default output is compact and package-centric, improving scan speed:
✓  internal/systems/gateway/router (13.623s) (coverage: 62.5% of statements)
✓  internal/systems/product/handlers/alert (10.964s) (coverage: 30.0% of statements)
✓  internal/systems/product/handlers/apikey (12.904s) (coverage: 54.7% of statements)
✓  internal/systems/product/handlers/audit (10.318s) (coverage: 61.0% of statements)
✓  internal/systems/product/handlers/auth (10.807s) (coverage: 76.9% of statements)
✓  internal/systems/product/handlers/billing (11.017s) (coverage: 45.7% of statements)
✓  internal/systems/product/handlers/gateway (124ms) (coverage: 4.9% of statements)
∅  internal/systems/product/handlers/health (1.254s) (coverage: 0.0% of statements)
Debuggability was preserved by design:
make test-verboseremains available for full, detailed test logs- when tests fail, failure details are still emitted so root-cause analysis is not degraded
Engineering Trade-Offs We Managed
Speed vs Isolation
We optimized setup while preserving isolated suite databases. Avoiding shared mutable test state was non-negotiable.
Throughput vs Contention
More parallelism is not always faster. We tuned to the resource envelope of shared CI services instead of maxing worker count.
Fast feedback vs Exhaustive checks
We intentionally split checks by cadence, so every PR gets quick confidence and scheduled pipelines provide deeper guardrails.
Practical Framework You Can Reuse
If you are improving test performance in a similar stack, this sequence is effective:
- profile runtime by phase (bootstrap/setup/assertions/post-processing)
- remove repeated setup first (amortize expensive initialization)
- reduce setup round-trips (batch where safe)
- cap parallelism to contention threshold, not CPU maximum
- cache aggressively, but verify cache correctness boundaries
- split fast-path and deep-path quality checks by cadence
In most systems, these steps outperform micro-optimizing individual test functions.
Next Engineering Steps
The next iteration focuses on:
- tighter instrumentation around setup p95 and p99
- continued reduction of orchestration overhead in integration fixtures
- periodic recalibration of CI parallelism caps as test volume changes
Test infrastructure performance is compound leverage. Small foundational wins repeat across every pull request and every engineer.